Metadata-driven User Interface
The development of user interfaces (UI) is a time-consuming and costly process. Typically, the graphical user interface of a business application requires about 45% of the development time and 37% of the maintenance time.
Many business applications require the UI to be customizable as the requirements vary from one customer to another and from one end user to another. The client-side business logic for the UI may also need customization based on individual user need, including customizing validation rules, access controls, and other modifications.
Metadata-driven User Interface Development is one approach that aims at coping with the above-mentioned challenges and at decreasing the effort needed to develop UIs while ensuring UI quality. The Ebaas solves the problem by storing customizable components such as UI layout and client-side business logic as metadata in the database. This metadata can then be interpreted by a run-time engine to display the screen to users and to execute the client-side business logic when the user performs an action on the screen.
The Ebaas employs the metadata-driven technique by implementing many reusable UI components, such as the Data Grid, Forms and Site Map, that are customized by the metadata.
To be specific, this post describes the DataGrid which is one of the metadata-driven UI components provided by Ebaas.
The DataGrid
The data grid is one of the most commonly used UI in business applications. A data grid presents a set of data records in a two-dimension table, allows users to filter, add, update and delete records (CRUD operations) and more. In a typical business application, there are dozens or even hundreds of business entities, such as Customers, Products, Orders, Suppliers, Employee, etc. Almost every entity requires a development of a data grid UI along with the business logic. Therefore, it takes a huge amount effort in developing the data grids for these entities.
To decrease the effort needed to develop the data grids, Ebaas provide a metadata-driven data grid (Ebaas DataGrid) that provides a flexible and no-code alternative for implementing data grids.
Ebaas DataGrid is a UI component implemented using JavaScript, HTML5, and Angular. It can be bound to a business entity in a data model and provides the GRUD commands, attachments and access control logic automatically. It can be extended to have custom commands beyond the CRUD operations and full-text search (See Fig. 1).
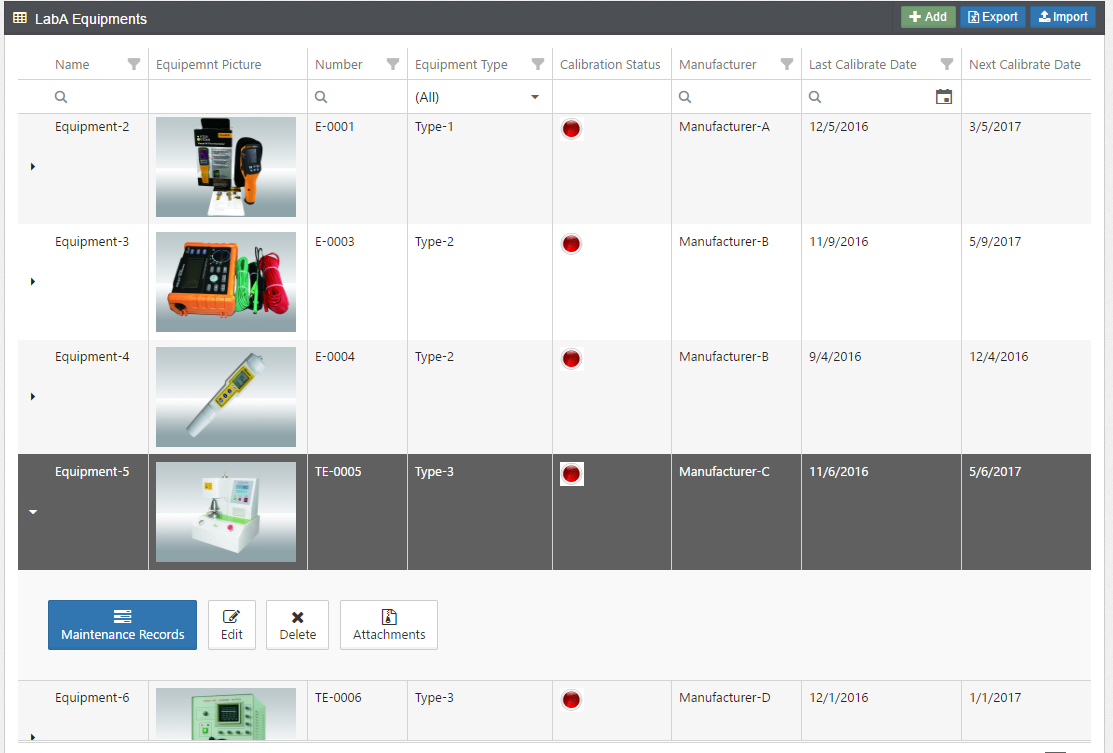 Fig.1: The DataGrid
To start using DataGrid, the first step is to create a business entity (Class) in a data model with the DesignStudio. In the tutorial of “Build your first application with Ebaas”, it guides you through the process of creating a class representing “Issues”. The class has definitions for its attributes (such as Subject, Description, Submit By, Submit Date, Status, Owner, etc.)
Once you have completed creating a class in a data model, you can quickly add a DataGrid component to the UI for interacting the class.
Configuring the DataGrid
Ebaas provides the SiteMapStudio allowing you to add a UI component to the application’s sitemap easily. In this tutorial, it explains how to use the SiteMapStudio to add a DataGrid component (See Fig 2).
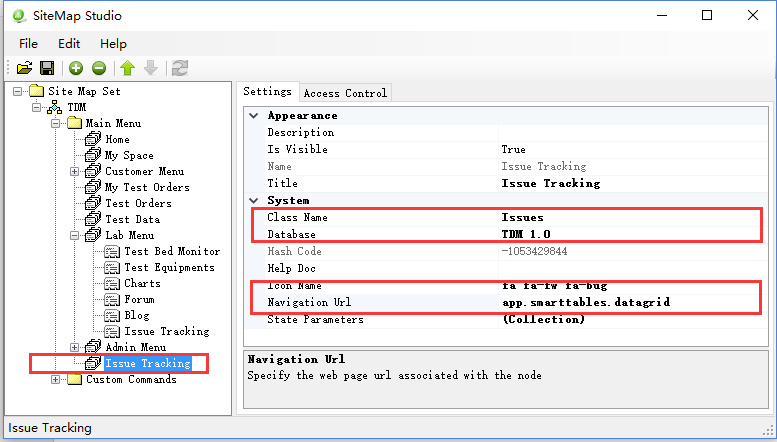 Fig.2: The SiteMapStudio tool
An example of the basic settings for a DataGrid is shown in Table 1, where the binding between the UI component and a data class is specified by the “Database” and “Class” settings.
| Setting Name | Setting Value | Description |
|---|---|---|
| Name | IssueTracking | A unique name of a menu item |
| Title | Issue Tracking | The display text of a menu item |
| Navigation URL | app.smarttables.datagrid | The URL of the “DataGrid” component |
| Database | TDM 1.0 | The name of a data model |
| Class | Issues | The name of a class in the data model |
| Icon Name | fa fa-fw fa-bug | A definition of an icon in Font Awesome icon sets |
Table 1: Settings of the “Issue Tracking” menu item
In this post, I will explain more advanced settings of the DataGrid.
Hide standard commands
By default, the DataGrid displays the standard commands, like Add, Edit and Delete. You can hide the commands for an individual user by setting up access control rules (see this tutorial). You can also hide these standard commands for all users by adding parameters to the “Navigation URL” of the DataGrid. For example:
app.smarttables.datagrid ({add: false, edit: false, delete: false, attachments: false})This definition hides all four standard commands from the DataGrid.
Enable export and import
You can enable the import and export features on the DataGrid by defining the URL as:
app.smarttables.datagrid ({import: true, export: true})You will notice that the “Import” and “Export” buttons are displaying on the title bar of the DataGrid. To complete the import feature, you need to set up an import package (See this tutorial).
Enable tracking changes
If you want to get notified of changes to the data records in the grid, you can enable the “Track” features by defining the URL as:
app.smarttables.datagrid ({track: true})With this parameter, a switch shows in the command row for each instance to turn on or off tracking (See Fig. 3).
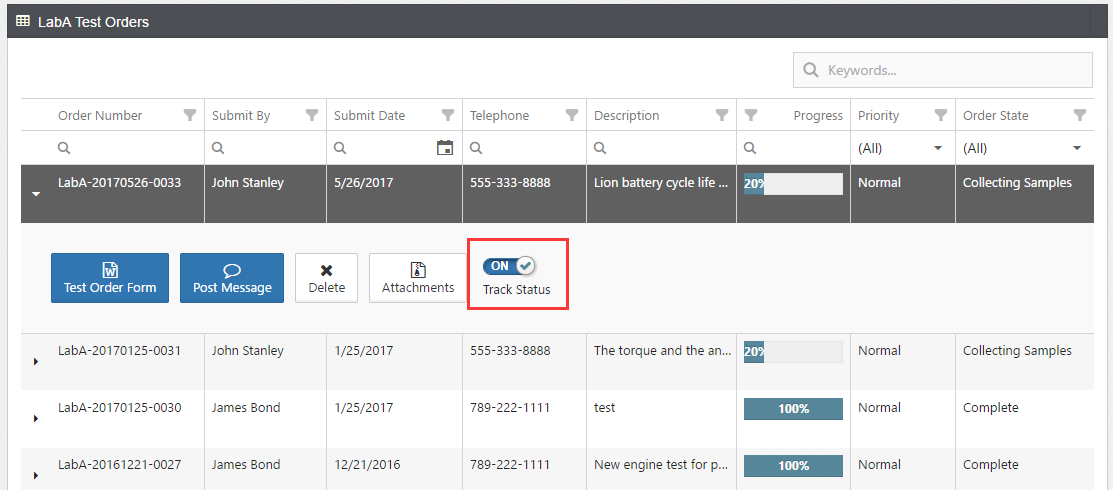 Fig.3: Track the changes
Enable full-text search
By default, DataGrid enables users to filter the records in the grid by entering or selecting a filter value under each column name. You can enable the full-text search capability by defining the URL as:
app.smarttables.datagrid ({seacrh: true})With the search enabled, the DataGrid looks like one in Fig 4. You also need to set up the index for the full-text search on the data model using DesignStudio, which is described in another post.
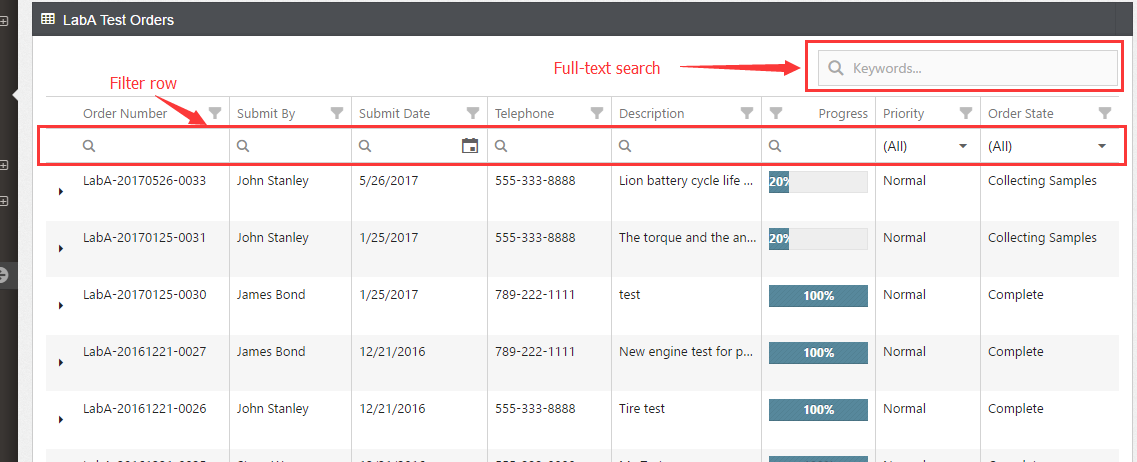 Fig.4: Filtering and full-text search
Display a customized data view
When you create a class in a data model, the Ebaas server creates two data views for the class. One is the default data view which includes the attributes indicated as “Included”; Another is the detailed data view which includes all attributes in the class.
By default, the columns displayed in the DataGrid represent attributes included in the default data view. If you want to customize the columns shown in the DataGrid, you can create a customized data view using the DesignStudio, and then specify the name of the data view for the DataGrid as shown in Fig. 5.
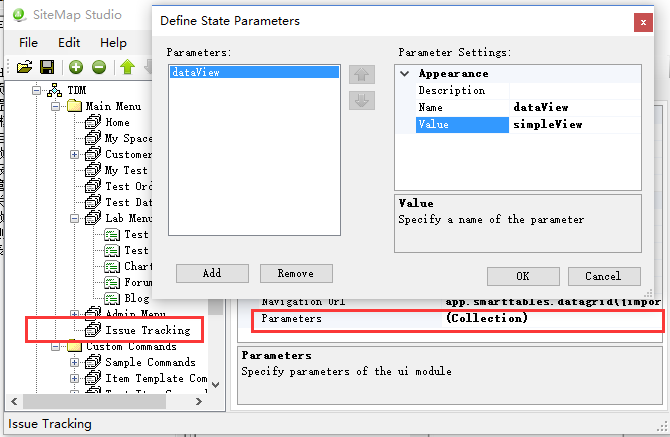 Fig.5: Specifying a customized data view for DataGrid
Adding Custom Commands
In addition to the standard commands and features mentioned above, you can add special actions as custom commands to the DataGrid. For example, open a customized form, write comments, manage related files or view the associated data records. You can also develop a UI module and invoke it from a customized command.
You can add custom commands to a DataGrid using the SiteMapStudio tool. For example, you first create a custom command group for the “Issues” class in the data model “TDM” (See Fig. 6).
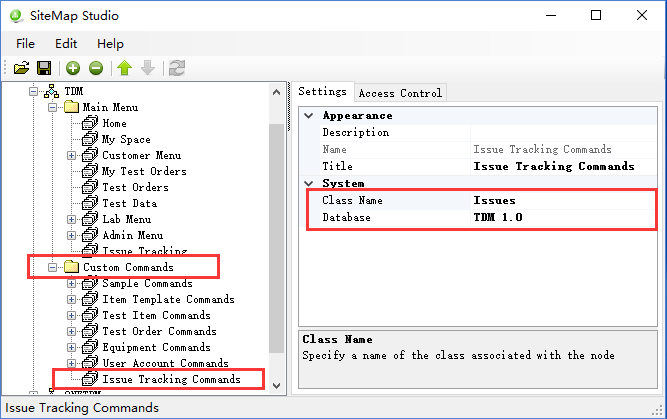 Fig.6: Create a custom command group for a class
Supposed that you want to have a command that views a data record in a modal window, you can add the custom command called “Open Form” under the custom command group (See Fig 7).
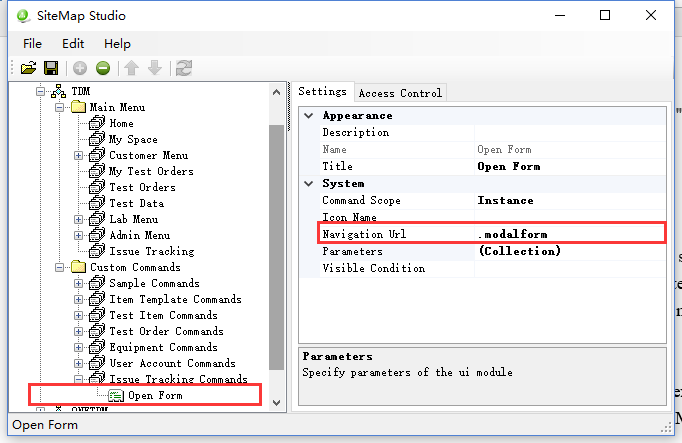 Fig.7: Add a “Open Form” custom command
The Navigation URL:
.modalformwhich is the URL of one of the custom commands provided by Ebaas front-end, which display the data records in a modal form. In addition to defining the URL, you also need to specify two parameters to this custom command (See Fig. 8).
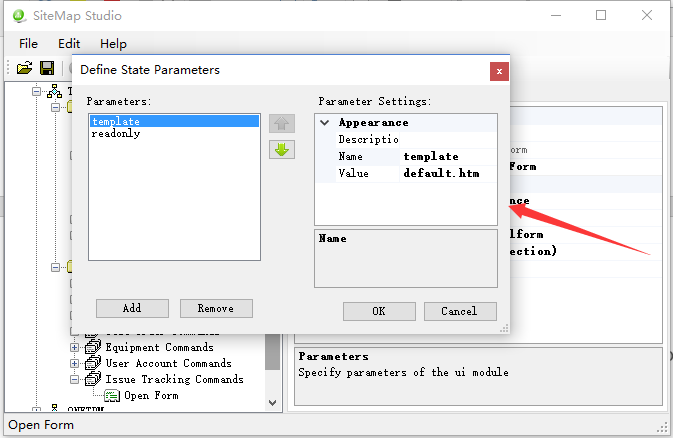 Fig.8: Specify the parameters of the custom command
The parameters are described in the table below.
| Setting Name | Setting Value | Description |
|---|---|---|
| template | default.htm | Indicate which form template to use |
| readonly | true | Indicate whether it is read-only |
After you add the custom command, you can see it appears in the command bar of the DataGrid with blue background color (See Fig. 9).
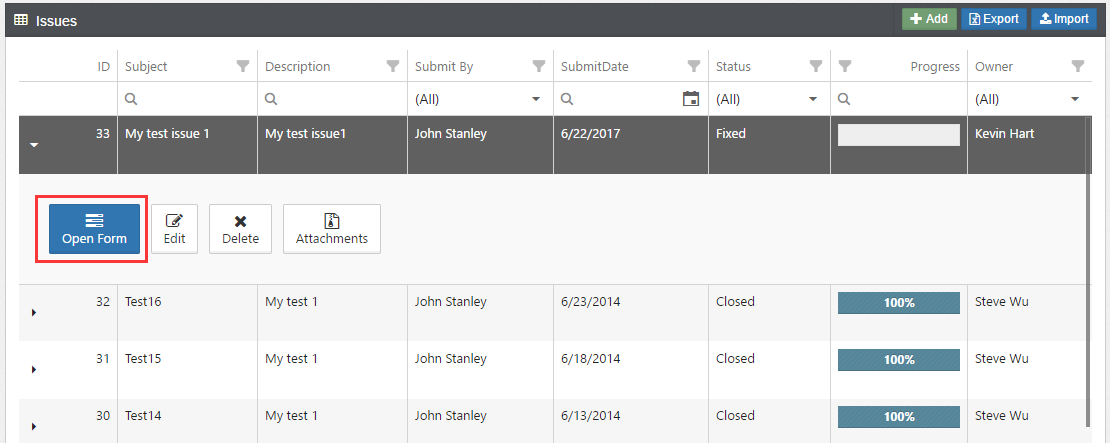 Fig. 9: The added custom command
You can add other custom commands in the same way as the “Open Form” command.
Conclusion
In this post, I describe how you can quickly customize the DataGrid to interact with various business data without writing any code. There are many metadata-driven UI components provided by Ebaas front-end that enable you to build the user interface of a business application quickly and adaptively.